Using the Debugger
To use the debugger, you must build with MCUXpresso and connect the MCU-Link.
This section introduces how to start the debugger using MCU-Link and explains its typical operations.
- The explanation assumes that you have successfully written and run a program using the MCU-Link as described in “Writing and Running the Binary (
.bin) file.” - For detailed information on how to use the debugger, please refer to the gdb and Eclipse manuals.
- A debugger has inherent limitations on its operation and the scope of its execution. We cannot provide information on the scope or details of these limitations.
About the Debugger Screen
When you start the debugger, a dialog box may appear asking you to switch the MCUXpresso (Eclipse) screen layout to the Develop perspective. In this dialog box, press [Switch] to switch. If you do not want to switch, check [Remember my decision] and press the [No] button.
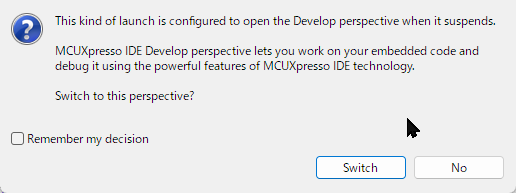
Dialog to change to Debug layout
Since there are efficient screen layouts depending on the work content, we recommend you get used to the operation of changing the layout. (Reference: About the Screen Layout)
The following are commonly used for screen layouts:
- C/C++ Perspective : Select from [Window] > [Perspective] > [Open Perspective]
- Develop Perspective :
- Debug Perspective : Select from [Window] > [Perspective] > [Open Perspective]
- Breakpoints view : Located within the Debug Perspective. Alternatively, select [Window] > [Show View] > [Others…] > [Debug/Breakpoints] from the menu.
Project settings before debugging
Normally, when debugging, you select Debug in the project’s build settings. The Release build does not include debug symbols, so you cannot debug by referencing the source code.
Also, if you want to debug the code within the TWENET library, it’s smoother to debug with these projects open. (Select the TWENTExxx project from the [Project Explorer] and then right-click to select [Open Project].)
Pre-configured Breakpoints
For the first-time use, there should be no pre-configured breakpoints, so you don’t need to consider this, but we’ll mention it first as it’s a solution to a problem you might experience while using it.
If the debugger does not start as expected (it doesn’t stop at the beginning of main()), try deleting or disabling all pre-configured breakpoints before starting the debugger. The debugger may fail to start normally if there is a conflict between the current source code, the executable binary, and the breakpoints you set in the past.
Launching the debugger
The operation for rewriting the program file (.bin) and launching the debugger is not much different. For handling errors and other issues, please refer to “Writing and Running the Binary (.bin) file.”
- First, build the project with the Debug configuration and ensure there are no errors.
- Click the [Debug] button on the [MCUXpresso IDE - Quick Start Panel].
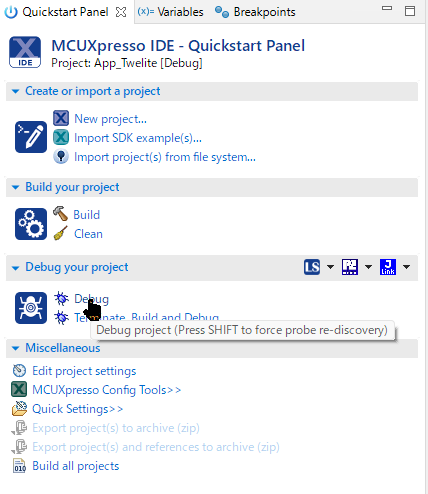
Debug icon
- When the program writing for debugging is complete, it will break at the beginning of the
main()function. (*If you have not changed the debugger settings)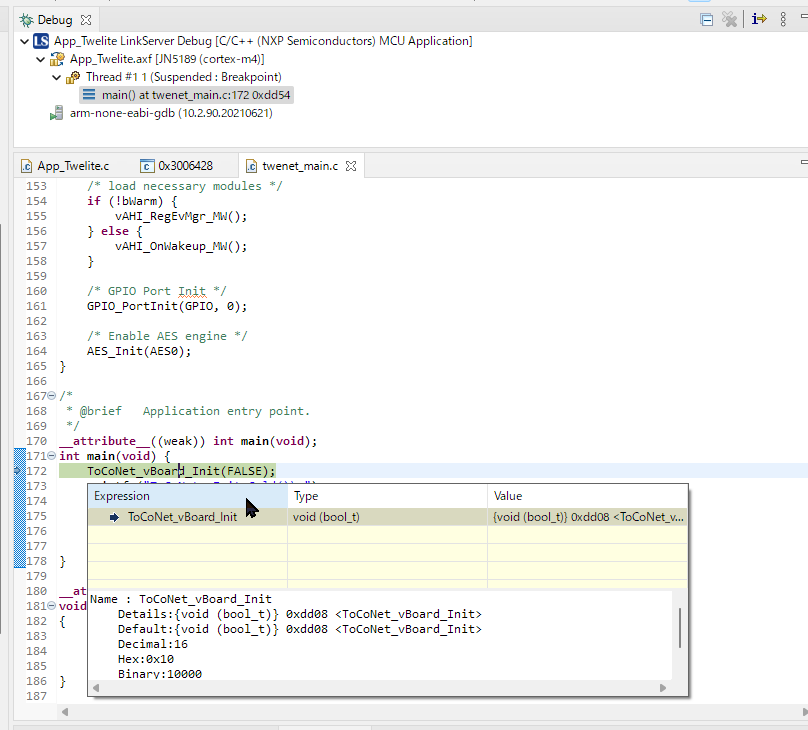
Debug-main()
debugger operations
How to set a break point
Breakpoints can be set and unset in the source code editor.
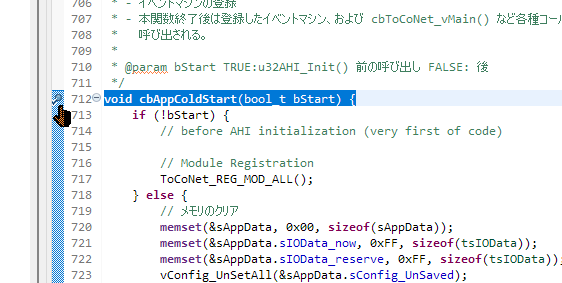
Breakpoint
You can also set or unset them by selecting [Run] > [Toggle Breakpoint] from the menu in the source code editor.
In addition, you can check the list of set breakpoints in the [Breakpoints View].
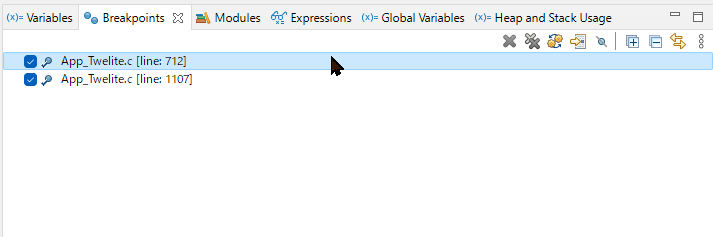
Breakpoints View
Controlling Execution
To control execution, such as stepping through the code, open the [Run] menu.
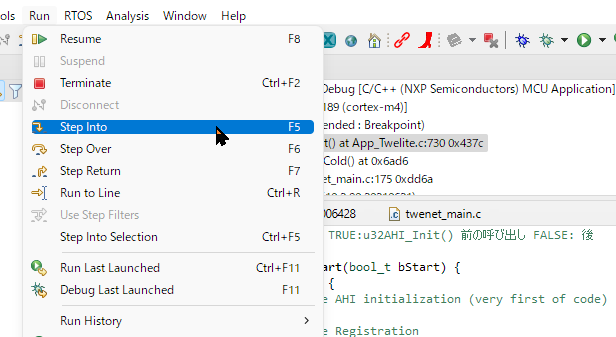
Run Menu
Execution is often controlled via keyboard shortcuts, so here is a list of frequently used keys:
| Key | Action | Description |
|---|---|---|
| F5 | Step Into | Executes step by step, including functions on that line. |
| F6 | Step Over | Executes up to the next line. |
| F7 | Step Return | Executes up to the return of the current function. |
| F8 | Resume | Resumes execution (continues until the next breakpoint). |
| Ctrl+R | Run to Line | Executes up to the selected line. |
Suspend/Terminate
To suspend the debugger, select [Run] > [Terminate] from the menu, or press Ctrl+F2.
Useful Features
You can open each View from the menu by selecting [Window] > [Show View] > [Other…].
- Variables: To check local variables.
- Breakpoints: List of breakpoints.
- Expressions: To watch variables and check their values.
- Global Variables: To watch global variables and check their values.
- Heap and Stack Usage: Heap and stack status.
- Memory: Dump of memory regions.
- Peripherals: To check the values of peripheral registers.
- Registers: To check CPU register information.
Troubleshootings
Does not respond after waking up from sleep
It is impossible in principle to debug the operation when waking up from sleep.
When debugging, it is necessary to handle it by not putting the application to sleep and instead using a running code that simulates sleep.
The debugger does not start even though it was working just before
Exit MCUXpresso and unplug and re-plug the debugger’s USB. If that doesn’t help, restart your PC and delete the .launch file.
the Debug icon is grayed out and cannot be clicked
If the Debug icon is grayed out and cannot be clicked, it’s likely because a file from the TWENETxxx library is open and that library itself is selected in the [Project Explorer]. The library itself is not a project that can be debugged directly. You should select the application’s project and then operate the [Debug] button.
nothing is displayed in the Peripherals tab
It is possible that nothing is displayed in the Peripherals tab depending on the state of MCUXpresso. This may improve by closing MCUXpresso once and restarting it.
To use SWO
This feature is not subject to support inquiries.
SWO is a mechanism for quickly retrieving information from a microcontroller and can be used to output low-cost debug messages and observe microcontroller function calls and interrupt states.
As far as we have evaluated, it is difficult to use on the JN5189 due to unstable debugger startup, so we do not actively recommend it. However, the document on About printf (Debugging, Serial Output) explains the information we are aware of, as well as the definitions and descriptions within the TWENET library.