This section explains the screens and operation methods of the TWELITE STAGE APP.
How to Launch the App
To launch the TWELITE STAGE app, execute the executable file located in {MWSTAGE Installation}.
When replacing the executable file of the TWELITE STAGE app due to updates, be sure to copy it to the specified folder {MWSTAGE Installation}. Behavior is undefined if the executable is placed in any other path.
The method of execution varies depending on the platform (Windows, macOS, Linux).
System
Extension
Notes
Windows
.exe
Double-click the executable file in Explorer
macOS
.command
Double-click the executable file in Finder
Linux
RasPi
.run
Depends on the distribution and installation environment.Execute as a command from a terminal window (such as xterm) on the X Window System
Executable Types of the App
The TWELITE STAGE APP has two types of executables.
TWELITE_Stage.{extension} - Launches with standard settings.
TWELITE_Stage_VSCode.{extension} - Configured to “Use VSCode” (settings saved in TWELITE_Stage_VSCode.ini). When the VSCode usage setting is enabled, the app operates in a way suitable for development work using VSCode.
The TWELITE STAGE APP does not produce errors when multiple instances are launched, but some features (such as the sensor graph function) may malfunction if multiple instances are running simultaneously.
Therefore, when running multiple apps at the same time, you need to duplicate the executable and launch separate files. This separates various configuration and input/output files, avoiding mutual interference.
App Interface
When you launch the app, two types of windows are displayed:
Main Window
Displays the user interface of the TWELITE STAGE APP.
The serial port under connection (e.g. TWELITE-R or TWELITE STICK) is displayed in the title bar.
All operations of the TWELITE STAGE APP are performed within this window.
Press the ALT (Cmd) key to display the operating aid screen.
The [ A ][ B ][ C ] buttons appear at the bottom of the screen and are used for operation. These buttons can be pressed and held down to call up sub-functions.
Command Window
Usually not used, but displays auxiliary information.
Shows serial communication content, making it ideal for checking logs.
When launched from the command line, the originating terminal acts as the command window.
Example Screen of TWELITE STAGE APP
Exiting the App
Exit the app by any of the following methods:
Move the mouse pointer to the upper right of the execution screen and press the exit button displayed within the screen.
Close the app window (on macOS, ⌘Q can also be used).
On rare occasions, the execution screen may remain after the exit operation. In such cases, please try the following:
Close the TWELITE STAGE APP command line window.
Force quit the app (refer to your system’s documentation for how to force quit).
1 - Key and Mouse Operations
Key and mouse operations for TWELITE STAGE APP
Windows
macOS
Linux
RasPi
This section explains the key and mouse operations used in TWELITE STAGE APP.
Key Operations
Windows
macOS
Linux
RasPi
Key inputs performed while holding down Alt (Cmd) are assigned to operations such as changing the settings of TWELITE STAGE APP. Other key operations generally function as normal text input.
Common Keys
Windows
macOS
Linux
RasPi
Key
Meaning
ESCESC
Quickly press ESC twice. Cancel or return to the previous screen.On some screens, pressing once returns to the previous screen.
ENTER
Enter, Select
BS
Delete one character
Cursor Keys↑↓
Select item
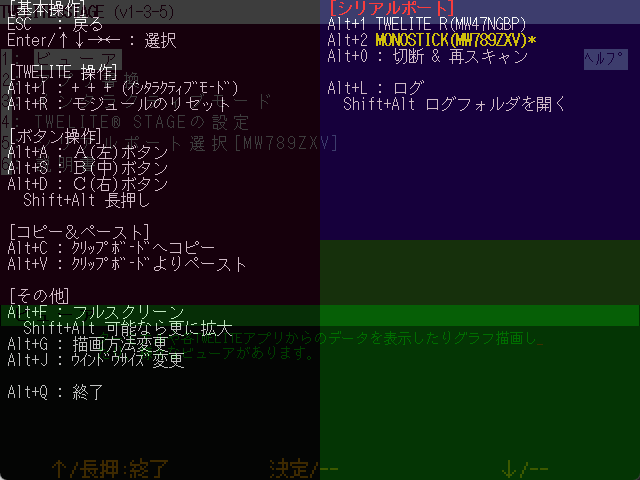
Help Screen
Windows
macOS
Linux
RasPi
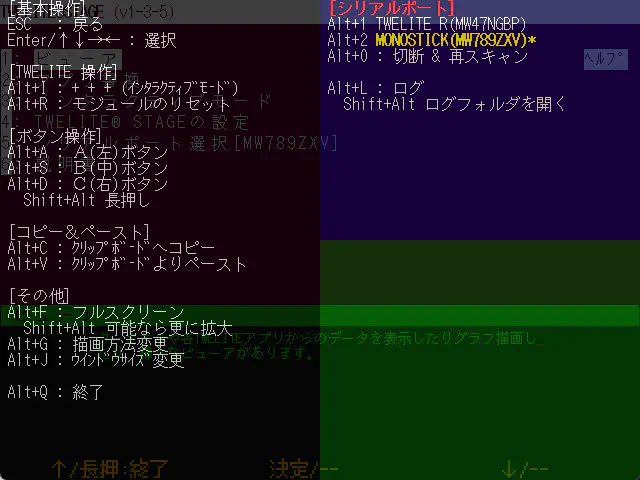
Hold down Alt (Cmd) to display the help screen. The help screen shows explanations of keys that can be used together with Alt (Cmd) and some operational status.
The help screen can also be displayed by moving the mouse pointer to the top-left corner of the screen.
Help Screen
Alt (Cmd) + Operations
Windows
macOS
Linux
RasPi
This section explains operations performed while holding down Alt (Cmd).
In the table below, the Alt (Cmd)+ prefix is omitted. You can check the available keys from the help screen above, but supplementary explanations are provided in the table below.
Alt (Cmd)+ Key
Meaning
I
Inputs + + +. This is the key sequence to enter interactive mode.※ Apps that perform intermittent operation due to sleep are not supported.
R
Resets the module. Controls the reset pin using the functions of TWELITE R or MONOSTICK.
A, S, D
Press buttons A, B, C.
Shift+A, S, D
Long press buttons A, B, C.
C
Copies the text displayed on the screen to the clipboard. (The range varies depending on the screen)
V
Pastes from the clipboard as keyboard input.
F
Switches to full-screen display. If Shift+F is pressed, it enlarges further if possible.
G
Changes the screen rendering method. It emulates a 640x480 LCD screen, but for enlargement, four rendering styles can be selected: (1. LCD monitor style / 2. CRT style / 3. Enlarged with dots emphasized / 4. Enlarged with dots blurred).※ You can change the startup setting in the settings menu.
J
Selects the screen size. Available sizes are {640,480}, {1280,720}, {1280,960}, {1920,1440}, {2560,1440}, {320,240}.※ Can be set as startup setting in the settings menu.
Q
Quits TWELITE STAGE APP.
0
Disconnects the serial port and shows the list of serial ports again.
1, 2, …
Selects the serial port.
B
Change baud rate if serial port is open (9600, 19200, 38400, 57600, 115200, 234000).
L, Shift+L
Starts logging serial port input/output. When finished, the log file opens with Notepad on Windows or Log Viewer on macOS. Shift+L opens the log storage folder.
Other Operations
Key
Meaning
Alt (Cmd)+Shift+Ctrl+m
Opens the MWX library code folder.
Alt (Cmd)+Shift+l
Opens the log folder.
Mouse Operations
Windows
macOS
Linux
RasPi
Mouse operations mainly involve left-clicking, but right-click, right double-click, and the scroll wheel may be used.
Mouse Operation
Meaning
Left click
Select
Left click and drag
Used on some screens (e.g., dragging on graph screens)
Left double-click
Not used
Right click
Used on some screens
Right double-click
Exit the screen (same as ESCESC)
Scroll wheel
Used on some screens (e.g., zoom in/out on graph screens)
Mouse Control of A, B, C Buttons
Windows
macOS
Linux
RasPi
When you move the mouse pointer to the menu display at the bottom of the screen, buttons labeled [ A ], [ B ], and [ C ] appear. TWELITE STAGE APP assigns functions of the hardware buttons arranged in this way to each screen. You can call the functions by left-clicking or long-pressing these buttons. (They can also be selected with Alt (Cmd)+a,s,d or Alt (Cmd)+Shift+a,s,d)
Example of virtual [ B ] button displayed at the bottom of the screen
Mouse Control of Screen Operations
Windows
macOS
Linux
RasPi
On Windows/macOS/Linux, TWELITE STAGE APP screens are basically composed of text only, but menus, buttons, and tabs can be operated with the mouse.
Example of Commander Screen
The screen consists of text only, but the tabs at the top of the screen and inverted text can be selected by left-clicking with the mouse.
2 - Screen Operations
Operation instructions for each screen of TWELITE STAGE APP
Windows
macOS
Linux
RasPi
Example of the menu screen
Windows / macOS / Linux / Raspberry Pi
TWELITE STAGE APP is an application launched from the console screen (command line). It outputs information to both the console screen and window screen.
The console screen displays UART output similar to a terminal.
In some environments, the console screen may accept input, but this is not considered an officially confirmed feature.
Raspberry Pi (nox)
Displays on the framebuffer without using X11.
Normally (when started from a shell screen on the framebuffer), the console screen is not displayed.
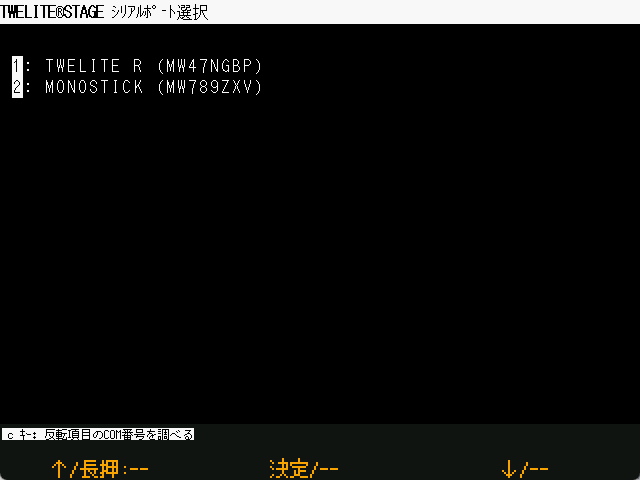
2.1 - Serial Port Selection
Operation instructions for the serial port selection screen
Windows
macOS
Linux
RasPi
Overview
On Windows / macOS / Linux, a screen to select the serial port connected to TWELITE is displayed at startup. However, the serial port can also be connected later.
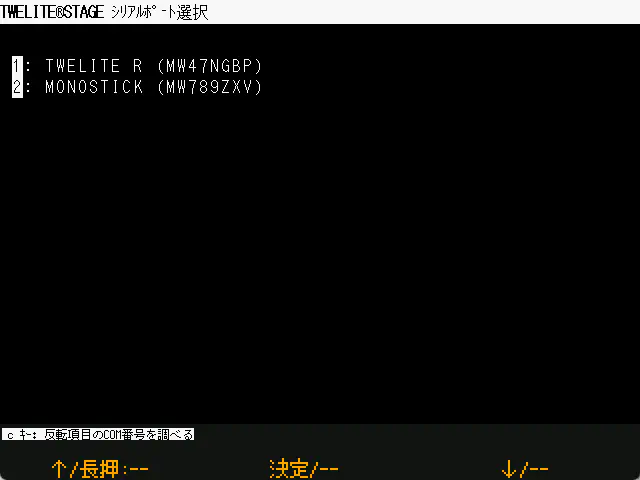
Example of the serial port selection screen
In the TWELITE STAGE app, the serial port selection and the processing of each screen are not linked. For example, if you start the viewer without selecting a serial port, the display will not update. When you select a serial port in this state, the viewer display will be updated.
Also, the serial port can be switched at any time using the shortcut keys Alt(Cmd) + 0, 1, 2, …
Windows
Press the c key to display the COM port name of the serial port currently highlighted in the list.
Raspberry Pi
On Raspberry Pi, in addition to USB devices, if /dev/serial0 and /dev/serial1 exist, serial0 and serial1 will be displayed. Normally, serial0 is used.
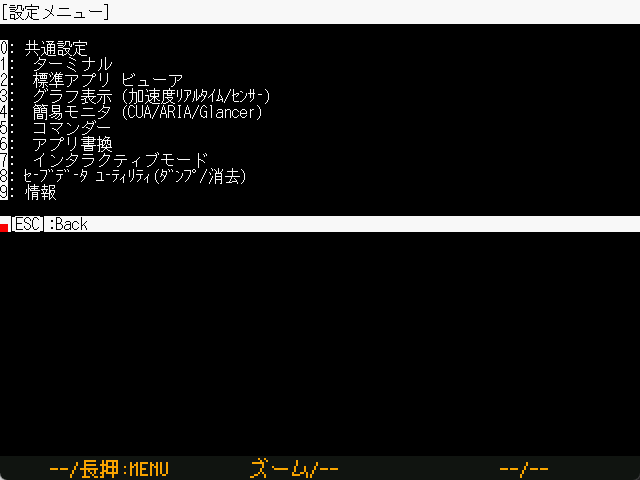
2.2 - Main Menu
Operation instructions for the main menu screen
Windows
macOS
Linux
RasPi
This is the top level of the hierarchical menu.
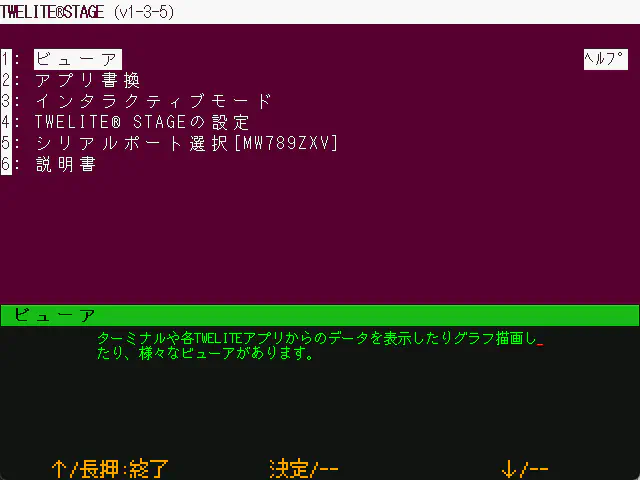
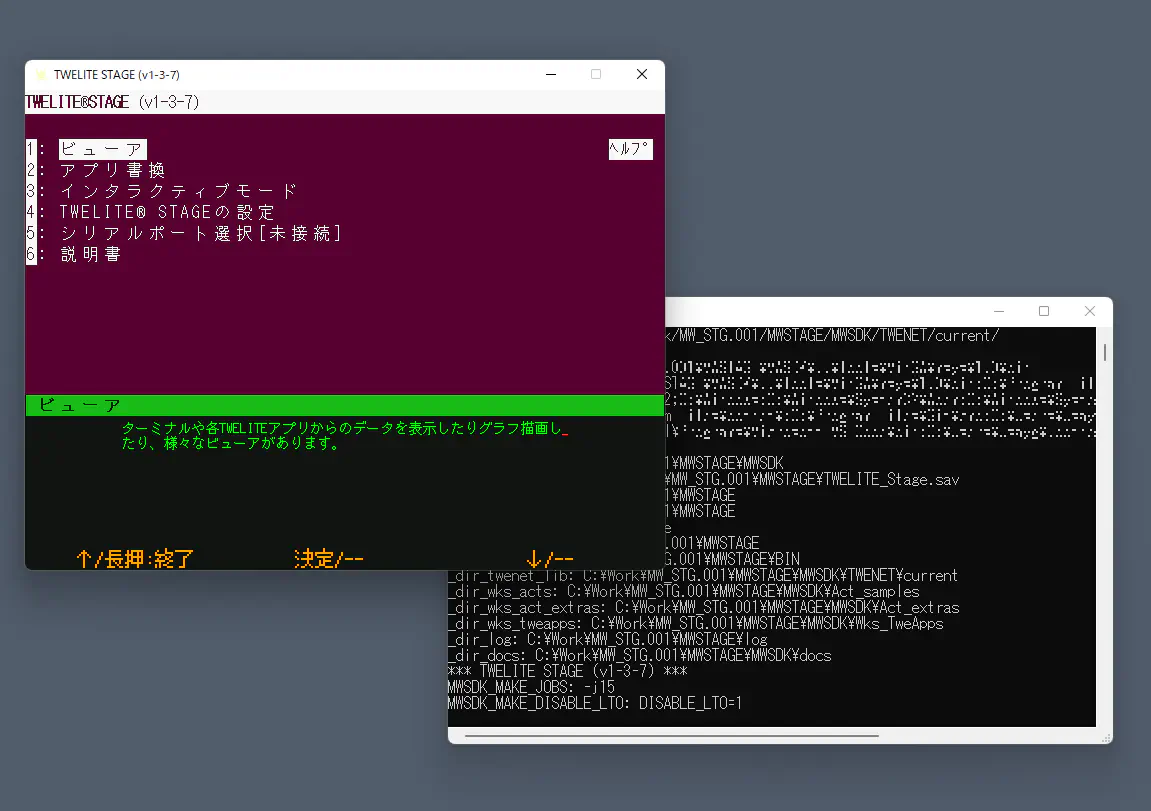
Example of the main menu screen
On this screen, you select a menu. When a menu is highlighted, a brief explanation is displayed in green text at the bottom.
Viewer: A viewer that interprets and displays packets received from TWELITE. In many cases, the receiving TWELITE is programmed with App_Wings.
Write Firmware: Build the firmware and write it to the connected TWELITE.
Interactive settigns mode: Configure the connected TWELITE settings via interactive mode.
Settings of TWELITE STAGE: Configure various settings of the TWELITE STAGE app.
Select SERIAL port: Select the serial port.
Open MANUAL: Menu to display manuals. Opens the following manuals in a browser:
TWELITE STAGE App (this document)
MWX Library
TWENET_C Library
2.2.1 - Viewer
About the viewer
Windows
macOS
Linux
RasPi
The viewer is a feature for displaying information received from a connected TWELITE and sending commands.
Each viewer is a relatively small program that also serves as a sample for how to use the mwm5 library.
2.2.1.1 - Terminal
Operation instructions for the Terminal screen
Windows
macOS
Linux
RasPi
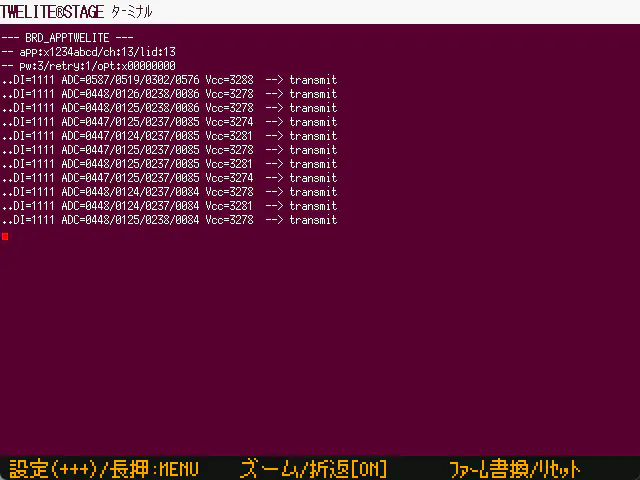
Example of the Terminal screen
Overview
A general VT100-compatible serial terminal.
Supports TWELITE interactive mode and reset control.
Operations
Operation
Description
[ A ]
Input the + + + sequence (interactive mode)
[ A ]Long press
Exit this screen and return to the previous menu.
[ B ]
Display a partial area of the first screen with a larger font.The area is selected so that the cursor is visible on the screen, but depending on the screen output, the desired part may not be visible.
[ B ]Long press
Toggle word wrap ON/OFF.By default, word wrap is enabled, but you can also display without wrapping. Characters beyond the right edge of the screen will not be displayed.
[ C ]
Move to the firmware update screen.During firmware development, source code modification, operation check, build & write are frequently performed, so a shortcut is provided.
[ C ]Long press
Control and reset the TWELITE reset pin.
ESCESC
Press the ESC key twice quickly to exit this screen.※ In most screens, pressing the ESC key once exits the screen, but in the terminal, a single ESC key input is used for other purposes, so double input is assigned.
2.2.1.2 - Standard App Viewer
Operation instructions for the Standard App Viewer screen
Windows
macOS
Linux
RasPi
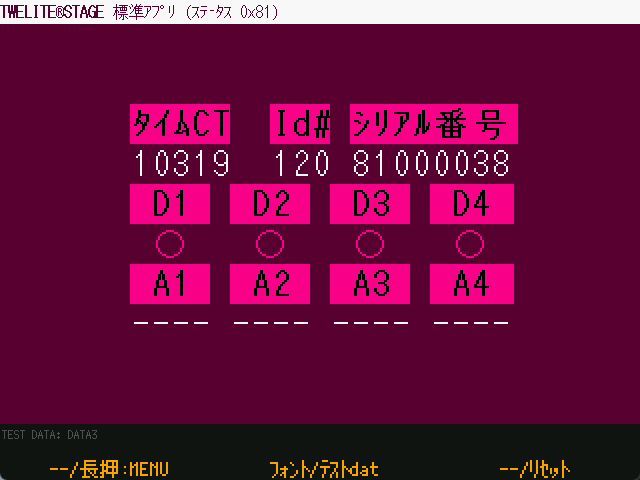
Example of the Standard App Viewer screen
Overview
The TWELITE communicating partner should have App_Twelite (Standard App) programmed. When a message indicating the status of buttons or analog inputs of the Standard App (0x81 message) is received, its contents are interpreted and displayed using the mwm5 parser library.
Please program the TWELITE connected to the PC with either App_Twelite (Standard App) or App_Wings (Parent/Relay App), and confirm that the data received from the communicating TWELITE is displayed in the terminal before use.
Operations
Operation
Description
[ A ]
No assignment
[ A ]Long press
Exit this screen and return to the previous menu.
[ B ]
Change the font.
[ B ]Long press
Display the screen with test dummy data.
[ C ]
No assignment
[ C ]Long press
Control the reset pin of the TWELITE to reset it.
ESCESC
Press the ESC key twice to exit this screen.
2.2.1.3 - Graph
List of graph screens
Accelerometer Real-Time Graph: Displays accelerometer sensor packets in real time. Frequency domain display and CSV file saving are available.
Sensor Graph: Saves data from various TWELITE sensors into an sqlite3 database and displays graphs.
2.2.1.3.1 - Accelerometer Real-Time Graph
Operation instructions for the Accelerometer Real-Time Graph screen
Windows
macOS
Linux
RasPi
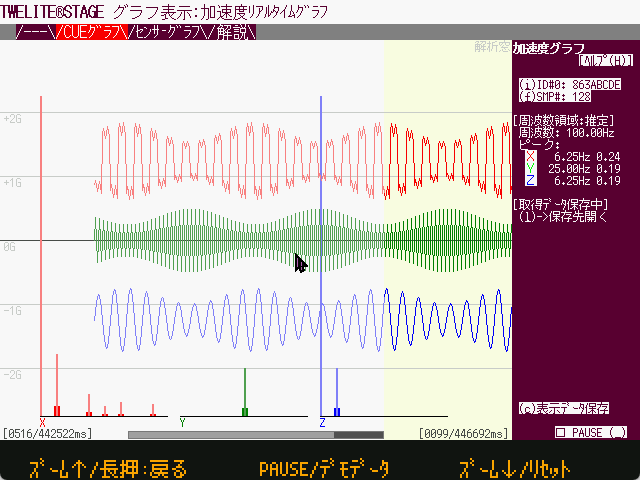
Example Display of Demo Data
Overview
This refers to packets received from TWELITE CUE and TWELITE Motion Sensor PAL. It can display accelerometer data in real-time, and includes features for frequency analysis and CSV export.
In the Accelerometer Real-Time Graph, each sample data is processed separately.
On the other hand, the Sensor Graph records one packet as one sample, even when continuous measurement with multiple samples per packet is performed.
It supports three modes: CUE mode, MOT mode, and 2525 FIFO mode.
When a continuous series of samples reaches a certain number (analysis window), frequency analysis of the XYZ axes is displayed. However, in 2525 FIFO mode, it is assumed to be always continuous.
When packet boundaries are explicit (e.g., when more than 3 seconds have elapsed since the previous packet, in CUE mode for each packet, or in MOT mode when the packet sequence number is discontinuous), four dummy samples are inserted and a pink background is shown.
Data from up to four nodes are stored on a first-come, first-served basis.
When operating multiple nodes, packet collisions cause many communication failures. Especially in FIFO mode, transmission intervals are almost fixed, and nodes try to transmit packets nearly simultaneously, which may cause prolonged transmission failures due to interference. As a rule, operate one node per wireless channel.
Typical settings for Motion Sensor PAL mode when using the Accelerometer Real-Time Graph are as follows:
To measure continuously at about 25Hz
t: set Transmission Interval (0)
p: set Sensor Parameter (03000000)
To measure continuously at about 50Hz
t: set Transmission Interval (0)
p: set Sensor Parameter (03000100)
To measure continuously at about 100Hz
t: set Transmission Interval (0)
p: set Sensor Parameter (03000200)
To measure 128 samples at about 100Hz every ~10 seconds
t: set Transmission Interval (10)
p: set Sensor Parameter (03000208)
To measure 256 samples at about 100Hz every ~10 seconds
t: set Transmission Interval (10)
p: set Sensor Parameter (03000210)
To measure 64 samples at about 50Hz every ~10 seconds
t: set Transmission Interval (10)
p: set Sensor Parameter (03000104)
To measure 128 samples at about 200Hz every ~10 seconds
t: set Transmission Interval (10)
p: set Sensor Parameter (03000308)
Operation
Operation
Description
Top right(i)ID# button
Click to switch the ID.(Note: Continuous sample data in FIFO mode is not suitable for multi-ID operation)
Top right(f)SMP# button
Click to change the analysis window size among 64, 128, and 256.
Bottom right(c)Save Display Data button
Exports data in CSV format to the log folder.Outputs from the oldest sample in the buffer to the latest sample at the right edge of the screen.(Note: The output is always 5120 samples, with the latest data at the end)
Bottom rightPAUSE( ) button
Pauses display updates.(Note: Samples are still collected until the internal temporary sample buffer is full)
Mouse drag(Graph area)
Moves the position of displayed samples.
Mouse drag(Bottom scrollbar)
Moves the displayed sample position in larger steps.
Arrow keys→←
Moves the sample display area.
Arrow keys↑↓
Zooms in/out on the horizontal axis of samples (1x / 2x / 3x / 4x).(Note: Up to 2x when the analysis sample count is 256)
Sample Rate Estimation
The sampling rate is calculated from the packet reception times. It averages the reception times of multiple past samples to estimate one sample interval, so packet drops may cause significant errors.
Also, the related log timestamp (T_SMPL) is an estimated value and is delayed compared to the packet acquisition time.
Once sample rate estimation completes, graph scrolling becomes smooth.
Opening the CUE Graph Mode on Startup
Specify 31 in [STAGE Common Settings → Startup App Selection].
Log Output (Save Display Data)
Pressing the (c) Save Display Data button outputs up to 512 samples starting from the current display position (rightmost sample).
Note that the latest samples are recorded at the end, so there may be no data at the beginning.
Log file name is {log folder}/acc_snap_{timestamp}.csv.
Data has the newest sample at the right edge as sample number 512 (file end).
When frequency analysis is performed, the last samples used for frequency analysis are included.
Frequency analysis results are added to rows containing frequency analysis target samples (for 64 samples, results appear from sample 449 for 32 rows, showing from DC to high frequency components).
Label
Item Name
Description
#
SampleNumber
T_PKT[ms]
PacketReception Time
Multiple samples may be included in one packet, so samples with the same timestamp are listed.
SEQ
PacketSequence Number
Assigned to each packet; continuity indicates no packet loss.
T_SMPL[ms]
SampleTime (Virtual/Estimated)
Timestamp generated for each sample from packet reception time.Does not match the actual sampling time.(Note: Sample rate is estimated from packet reception intervals, and sample times are cumulatively added, so timestamps are delayed by one packet interval compared to actual sample time)
X[G]
X-axis Sample Value
Unit is G. Based on sensor values.
Y[G]
Y-axis Sample Value
Unit is G. Based on sensor values.
Z[G]
Z-axis Sample Value
Unit is G. Based on sensor values.
FD#
Frequency Analysis Calculation Index
For 64 samples, ordered as DC,1,2,...,31.
Hz
Frequency Analysis Frequency Axis Value
Estimated frequency, calculated as (FD# / FD_Len) * FD_Freq.
System time when the log file was opened(Note: TWELITE STAGE app side)
Date
Date when the log file was opened
Time
Time when the log file was opened
Time_Msec_part
Sub-second part of time when the log file was opened [ms]
Samples
Valid sample data
FD_Len
Frequency analysis sample count
FD_Start#
Frequency analysis start sample number
FD_Freq
Estimated frequency range for frequency analysis [Hz](Note: estimated from sample reception interval)
Log Output (Auto Save)
When the Accelerometer Real-Time Graph screen is opened and data is input, log files are automatically saved.
Log file name is log folder/accel_{serial number}_{timestamp}.csv.
While the screen is open, files are being written, so they may not be available for reading or may be incomplete.
Label
Item Name
Description
#
SampleNumber
T_PKT[ms]
PacketReception Time
Multiple samples may be included in one packet, so samples with the same timestamp are listed.
SEQ
PacketSequence Number
Assigned to each packet; continuity indicates no packet loss.
T_SMPL[ms]
SampleTime (Virtual/Estimated)
Timestamp generated for each sample from packet reception time.Does not match the actual sampling time.(Note: Sample rate is estimated from packet reception intervals, and sample times are cumulatively added, so timestamps are delayed by one packet interval compared to actual sample time)
System time when the log file was opened(Note: TWELITE STAGE app side)
Date
Date when the log file was opened
Time
Time when the log file was opened
Time_Msec_part
Sub-second part of time when the log file was opened [ms]
2.2.1.3.2 - Sensor Graph
Operation instructions for the Sensor Graph screen
Windows
macOS
Linux
RasPi
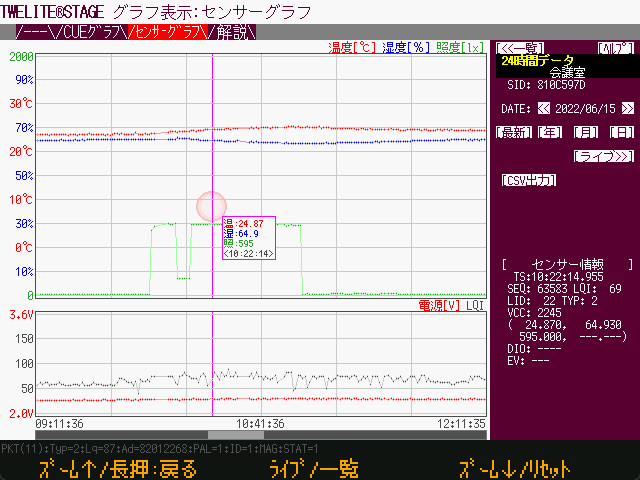
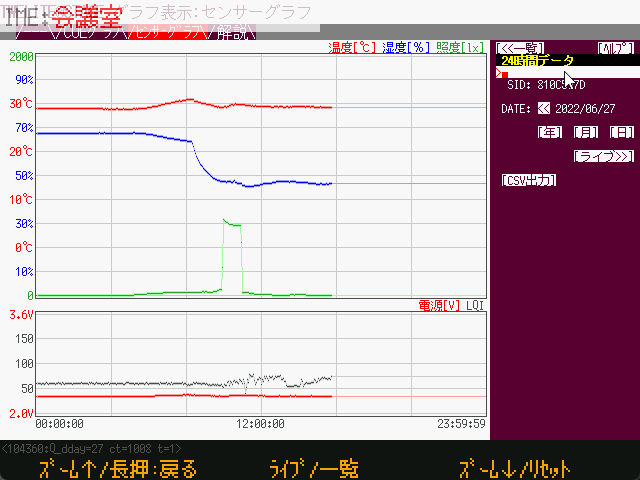
Example of data display
Overview
Various sensor data are recorded in an SQLite database and displayed on the screen in graph format. The database file can also be accessed by external applications.
You cannot run multiple instances of TWELITE STAGE APP with the same executable name to use the Sensor Graph simultaneously.
The database file is stored in the {MWSTAGE Installation}/log folder, and the filename is determined based on the executable name of TWELITE STAGE APP. If the executable names are the same, they will refer to the same database file. The TWELITE STAGE APP implementation does not assume multiple apps add data to the same database simultaneously. In some cases, this may cause database file access errors and cause TWELITE STAGE APP to crash.
For example, if you want to connect two MONOSTICK devices to a PC and run multiple “Sensor Graph” instances simultaneously, run multiple TWELITE STAGE apps with different executable names (e.g., TWELITE_Stage_a.exe, TWELITE_Stage_b.exe). The database filenames will be log/TWELITE_Stage_a_WSns.sqlite and log/TWELITE_Stage_b_WSns.sqlite, respectively.
The database uses SQLite (sqlite3) and is stored in the file {MW_STAGE Install}/log/{executable_name}_WSns.sqlite.
Specify 32 in [STAGE Common Settings → Launch App Specification].
About the Database Tables
sensor_data
Stores received data.
Column Name
Type
Description
_uqid
INTEGER
Sequential number used in the database
sid
INTEGERint32_t
Serial number stored as int32_t type.For example, a serial number “8123abcd” is stored as the integer value -2,128,368,691.
ts
INTEGERint64_t
Timestamp when the system received the packet, stored as int64_t.UNIX epoch (seconds since 1970).
ts_msec
INTEGER
Milliseconds part of the timestamp.
year
INTEGER
Year part of the local time from the timestamp.
month
INTEGER
Month part of the local time from the timestamp.
day
INTEGER
Day part of the local time from the timestamp.
hour
INTEGER
Hour part of the local time from the timestamp.
lid
INTEGER
Identifier such as LID assigned by the user.
lqi
INTEGER
Link Quality Indicator, an estimate of reception strength.
pkt_seq
INTEGER
Packet sequence number. The range of values depends on the firmware.
pkt_type
INTEGER
Type of wireless packet.2 PAL AMB6 ARIA1 PAL MAG*3 PAL MOT5 CUE0x101 App_Twelite*0x103 App_IO*Currently unsupported types
value
REAL
Measured value (definition varies by packet type).pkt_type->2,6: Temperature [°C]1: Magnet detection (00->No magnet, 01->N pole, 02->S pole)3,5: X-axis acceleration (average if multiple samples in packet) [G]0x101,103: Input IO bitmap (same as lower 8 bits of val_dio)
value1
REAL
Measured value (definition varies by packet type).pkt_type->2,6: Humidity [%]1: Unused3,5: Y-axis acceleration (average if multiple samples in packet) [G]0x101: ADC1 [V]103: Unused
value2
REAL
Measured value (definition varies by packet type).pkt_type->2: Illuminance [lx]6: Unused1: Unused3,5: Z-axis acceleration (average if multiple samples in packet) [G]0x101: ADC2 [V]103: Unused
value3
REAL
Measured value (definition varies by packet type).pkt_type->2: Unused6: Unused1: Unused3,5: Unused0x101: ADC3 [V]103: Unused
val_vcc_mv
INTEGER
Power supply voltage [mV]
val_dio
INTEGERint32_t
b0..b7: Values of DI1..DI8 (1 is LOW, 0 is HIGH level)b24..b25: Magnet value (if b28 is 1): 00->No magnet, 01->N pole, 10->S poleb28: If 1, magnet data is stored in b24..b25b31: Periodic transmission bit (magnet only)
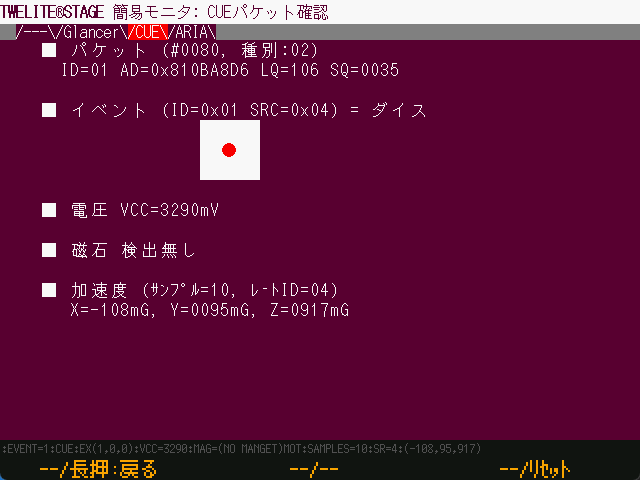
In CUE mode, acceleration events are always output.
Regardless of the wake-up factor, a fixed number of acceleration samples are measured after waking. Events are determined based on the acceleration measurement results.
Event
Number
Description
Dice
1(0x00) .. 6(0x06)
Determined based on periodic wake-up and magnetic sensor wake-up.If a large acceleration is detected after waking,an undetermined event (0xFF) may be detected.
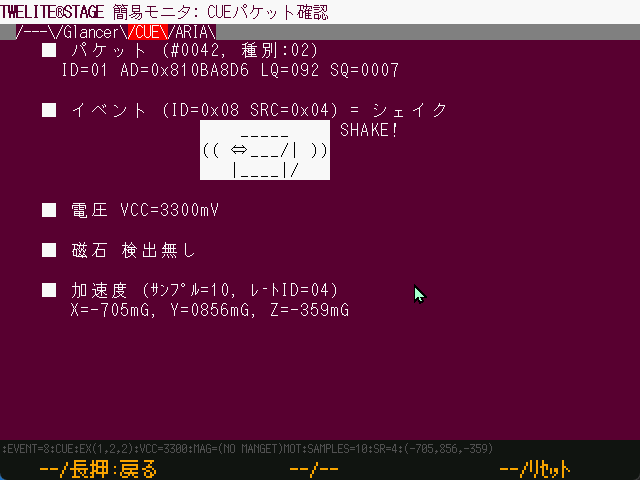
Move
16(0x10)
Occurs when the acceleration sensor detects acceleration above a threshold,resulting in a move or shake event.Move occurs when the measured acceleration change is relatively small,(acceleration change detected but no continuous acceleration change).
Shake
0x08
Occurs when the acceleration sensor detects acceleration above a threshold,resulting in a move or shake event.Shake occurs when the measured acceleration change is relatively large,(continuous acceleration changes detected).
Quantitative definitions for acceleration thresholds and event detection conditions are not provided.
Voltage
Power supply voltage of the module [mV].
Magnet
Displays the detected magnetic pole or no detection.
There is no function to indicate whether wake-up was caused by magnetic sensor detection.
Acceleration
Displays acceleration measured after waking.
Samples: Displays the number of acceleration samples, fixed at 10 samples.
Rate ID: Sample rate of acceleration, fixed at 04 (100Hz).
X, Y, Z: Acceleration on three axes. Calculated as the average of 8 samples. Unit is milli-G (1000mG = 1G = 9.8m/s²).
Example Screens
Example of Move Event Detection
Example of Shake Event Detection
2.2.1.4.2 - ARIA Viewer
Operation instructions for the ARIA Viewer screen
Windows
macOS
Linux
RasPi
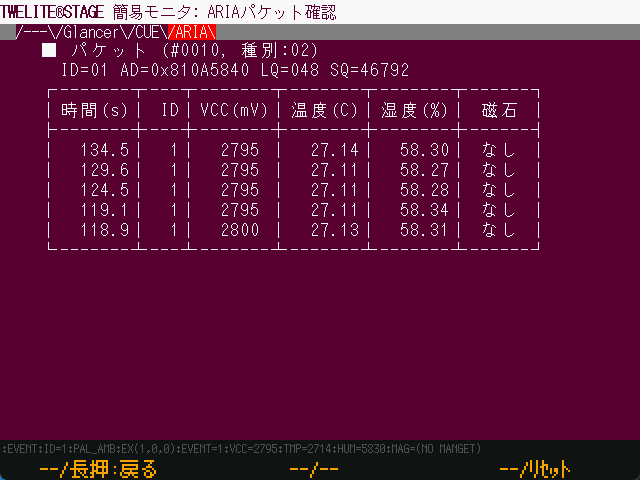
This page contains capture images from an older version.
Example display of temperature and humidity data table
Overview
Interprets and displays messages received from TWELITE ARIA.
By programming the connected TWELITE with App_Wings, it can display information received from communication partners’ TWELITE devices (App_Twelite, TWELITE PAL, … as long as the application ID and frequency channel match, mixed operation is possible).
Glancer is an English word meaning a person who glances (i.e., takes a quick look).
Operation
Use by switching between the list display screen and the selection display screen.
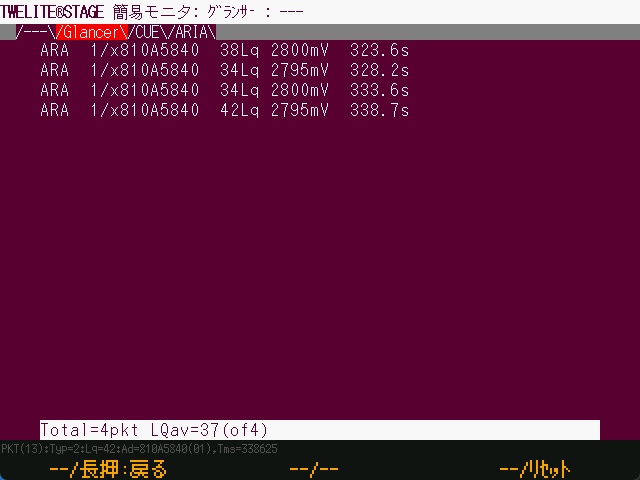
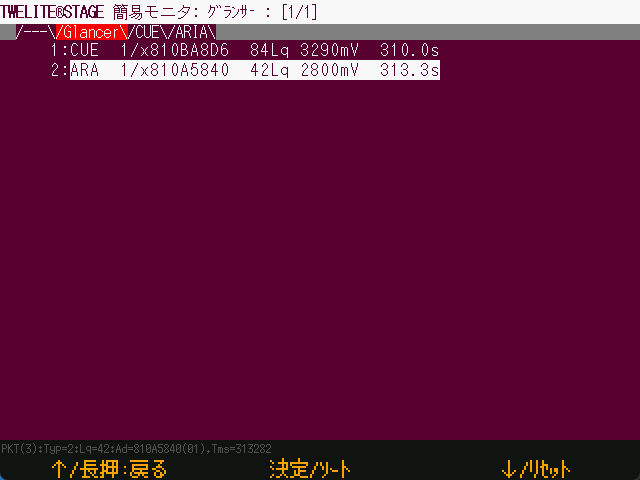
List Display
Example of list display
Lists information from communication partners.
Displayed content includes message type, logical device ID, serial ID, LQI (Lq), power voltage (if included in the information), and timestamp.
Operation
Description
[ A ]
Move to the previous item in the list.
[ A ]Long press
Exit this screen and return to the previous menu.
[ B ]
Switch to selection display.
[ B ]Long press
Sort items.The sort key changes sequentially each time sorting is performed.
[ C ]
Move to the next item in the list.
[ C ]Long press
Control the TWELITE reset pin and reset it.
ESC
Exit this screen.
Selection Display
Example of selection display
By moving items and highlighting one in the list display, then performing a selection operation, you transition to this screen. It shows information related to a specific communication partner in order of arrival.
The number of received packets and the average LQI since selection are displayed.
Operation
Description
[ A ]
No assignment
[ A ]Long press
Exit this screen and return to the previous menu.
[ B ]
No assignment
[ B ]Long press
No assignment
[ C ]
No assignment
[ C ]Long press
Control the TWELITE reset pin and reset it.
ESC
Return to the list display screen.
2.2.1.5 - Commander
Operation instructions for the Commander screen
Windows
macOS
Linux
RasPi
Overview
Commander is a feature to send serial messages to TWELITE.
Operation
The first screen of the Commander displays important notes.
At the top of the screen, there are tabs represented by text, which you can navigate by clicking with the mouse to switch between tab screens.
Operation
Description
[ A ]
Move tab (left)
[ A ]Long press
Exit this screen and return to the selection screen.
[ B ]
No assignment
[ B ]Long press
No assignment
[ C ]
Move tab (right)
[ C ]Long press
Control the reset pin of TWELITE to reset it.
ESC
Exit this screen and return to the selection screen.
Make sure the connected TWELITE has App_Twelite or parent/relay app (App_Wings) programmed, and after setting the application ID and channel, confirm that messages are being received from the communication partner.
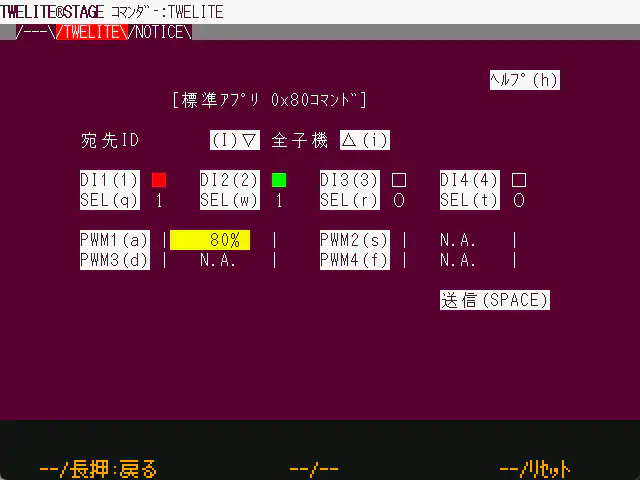
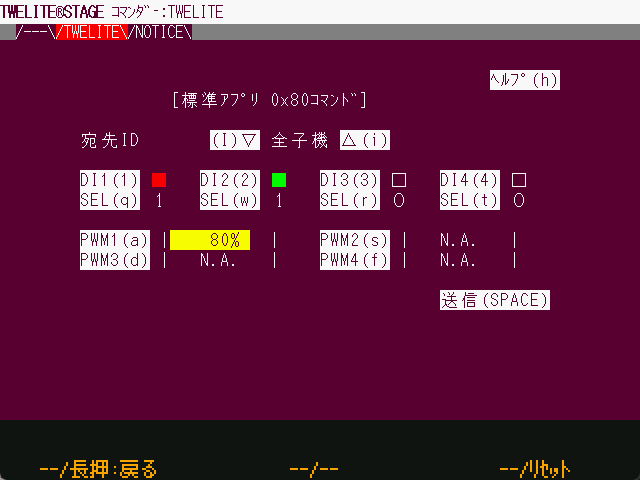
Example display of the TWELITE tab
Item
Description
Destination
Specify the TWELITE to send to.If you are a child device, specify “Parent:0”.If you are a parent device, specify “All children = 0x78” or a specific child ID (can be specified from 1 to 8).
DI1..DI4
Settings state from DI1 to DI4.■ means selected (LOW = GND level), □ means (HIGH = VCC level).Please specify SEL in the next item.
SEL
Selection bits for each DI.(If 0, the DI specification is ignored; if 1, the specification is enabled.)
PWM1..4
Set the PWM duty ratio.0 corresponds to GND level, 1024 (100%) corresponds to VCC level.PWM ports set to N.A. will not be changed.(Note: On the MW-STA-KIT-0/MW-STA-SOLO-0 boards, PWM1 is pulled up to VCC, so the LED lights brightest at 0 and turns off at 100%.)
Commands are generated each time an item is changed. Pressing the send button will resend the command with the current settings.
Make sure the connected TWELITE has App_Wings programmed, and after setting the application ID and channel, confirm that messages are being received from the communication partner.
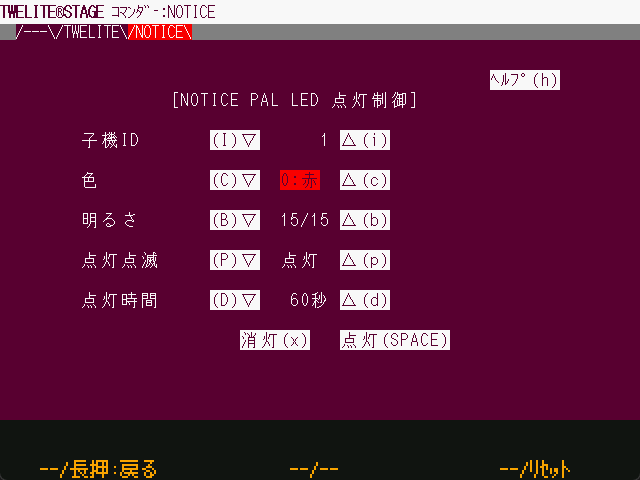
Example display of the NOTICE tab
Item
Description
Destination
Specify the ID of the TWELITE PAL to send to.Valid range is 1 to 8.
Color
Specify the lighting color from 7 colors.There are two types of white: one is RGB mixed color, and the other is a single white LED lit.
Brightness
Specify from 0 to 15. 0 means off.
Lighting/Blinking
Select lighting or blinking pattern.
Lighting Time
Automatically turns off after a certain time has passed since the command was issued.
Turn off (x)
Generate a turn-off message to turn off the LED.
Turn on (SPACE)
Send the current settings to turn on the LED.
Commands are generated each time an item is changed. Pressing the send button will resend the command with the current settings.
Display at the bottom of the screen
At the bottom of the screen, the timestamp when the command was generated and the command starting with : are displayed. The clipboard copies the contents of this screen.
2.2.2 - Write App Firmware
About the firmware writing function
Windows
macOS
Linux
RasPi
The firmware writing function allows you to write the TWELITE app (firmware).
Write pre-built .BIN files
Build from source files such as act and write
It eliminates the hassle of building source files, terminal disconnection, launching the writing utility, and terminal connection.
Automatically recognize TWELITE
After writing is complete, reset and then transition to interactive mode or terminal
From the list of projects, launch the project folder or environments like VSCode (except Raspberry Pi version)
From the list of projects, open related information web pages (except Linux and Raspberry Pi versions)
2.2.2.1 - Select from BIN
Operation instructions for the Select from BIN screen
Windows
macOS
Linux
RasPi
Overview
You can write pre-built applications ( .BIN files ).
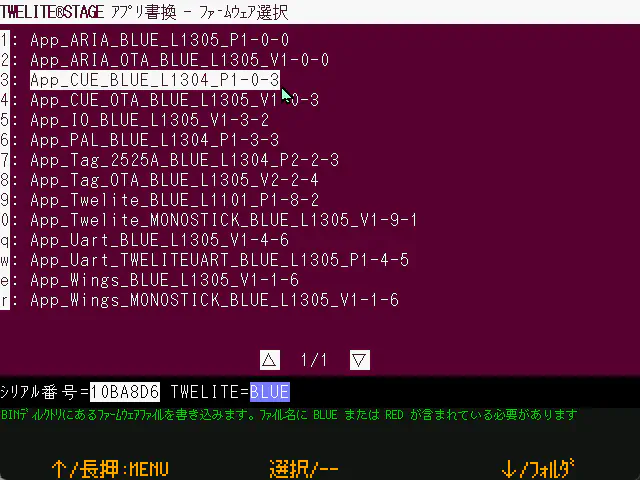
Example of the Select from BIN screen
When you select the menu, a list of .BIN files will be displayed. Please select the firmware to write.
If you want to use a file other than the pre-prepared .BIN files, please store the file to be written in the following location before selecting the menu.
Platform
Location
Windows, macOS, Linux, Raspberry Pi
{MWSTAGE folder}/BIN
In the BIN folder, please store .BIN files built with TWELITE STAGE without renaming the files (they are stored under the build folder of each project).
This function identifies TWELITE (BLUE/RED, etc.) from the file name.
2.2.2.2 - act Build & Write
Operation instructions for the act build & write screen
Windows
macOS
Linux
RasPi
Overview
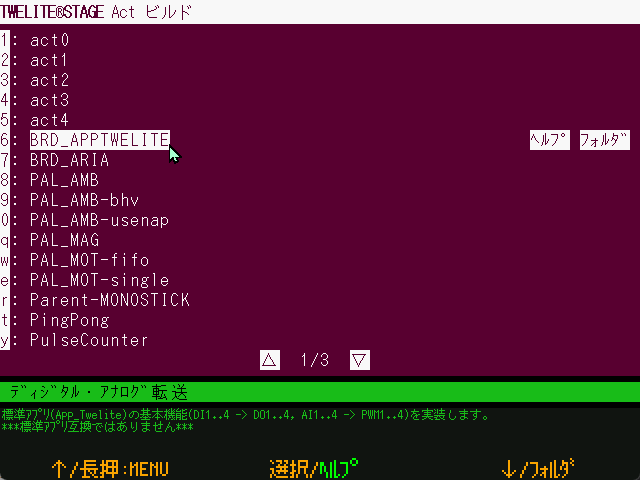
You can build and rewrite acts (act) written with the MWX library.
Example of sample act selection screen
This screen displays a list of projects using acts placed in the following path.
{MWSTAGE installation folder}/MWSTAGE/Act_samples
By default, it includes relatively small projects intended for use as samples.
Operation
You can build and write by selecting the project to write from the list.
After writing is finished, pressing ENTER or the [ B ] button will reset the TWELITE and transition to the interactive mode screen (or terminal screen, depending on settings).
If you have enabled the setting to use VSCode (Open folder in code under app rewrite), it will not build but open the screen to write the .BIN file under build/.
Operation
Description
[ A ]
Menu selection up
[ A ]Long press
Exit this screen and return to the selection screen.
[ B ]
Select
[ B ]Long press
Open related website in the OS default browser.(If registered in 000desc.txt in the project folder)
[ C ]
Menu selection down
[ C ]Long press
Open folder (project or related folder).You can set it to open with VS Code in the settings menu.
ESC
Exit this screen and return to the app rewrite menu.
Mouse click [Help]
Open related website.
Mouse click [Folder] or [VSCode]
Open related folder.
Mouse click [▽] or [△]
Move to next page or previous page.
2.2.2.3 - TWELITE APPS Build & Write
Instructions for operating the TWELITE APPS Build & Write screen
Windows
macOS
Linux
RasPi
Overview
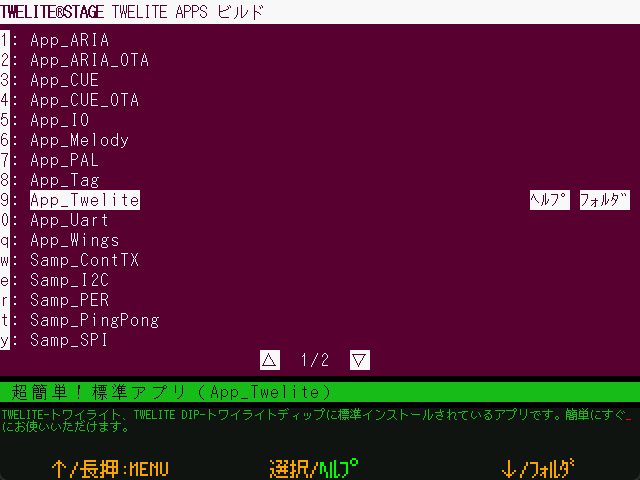
You can build and write TWELITE APPS written with the TWENET C library.
Example of the app selection screen
This screen displays a list of projects located in the following path:
{MWSTAGE installation folder}/MWSTAGE/Wks_TweApps
By default, it includes relatively large-scale projects intended for immediate use.
Operation
By selecting the project to write from the list, you can perform build and write operations.
After writing is completed, pressing ENTER or the [ B ] button will reset the TWELITE and transition to the interactive mode screen (or terminal screen, depending on settings).
If you have enabled the setting to use VSCode (Open folder with code in App Write), the build will not be performed, and the screen to write .BIN files under build/ will open instead. Screen
Operation
Description
[ A ]
Menu selection up
[ A ]Long press
Exit this screen and return to the selection screen.
[ B ]
Select
[ B ]Long press
Open the related website in the OS default browser.(If registered in the project folder’s 000desc.txt)
[ C ]
Menu selection down
[ C ]Long press
Open folders (project, related folders).You can set to open with VS Code in the settings menu.
ESC
Exit this screen and return to the App Write menu.
Mouse click [Help]
Open the related website.
Mouse click [Folder] or [VSCode]
Open the related folder.
Mouse click [▽] or [△]
Move to the next or previous page.
2.2.2.4 - Act_extras
Operation instructions for the Act_extras screen
Windows
macOS
Linux
RasPi
Overview
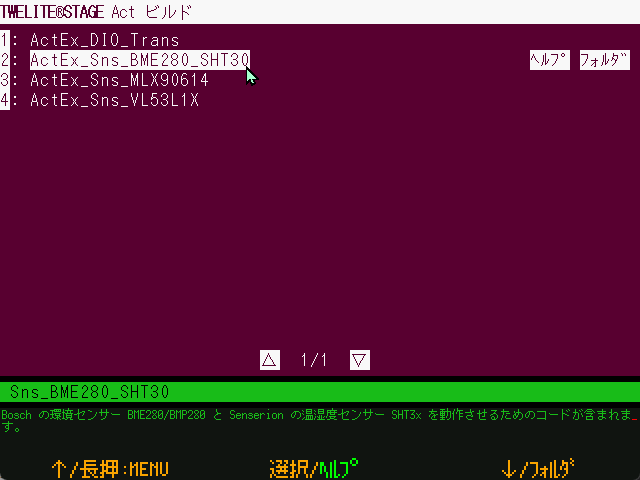
You can build and rewrite acts written with the MWX library.
Example of the act selection screen
This screen displays a list of projects using acts placed in the following path:
{MWSTAGE installation folder}/MWSTAGE/Act_extras
Unlike act build & rewrite, this includes projects that perform relatively complex processes intended for sample use, or projects that use external open source libraries.
Operation
By selecting a project to write from the list, you can perform build and write operations.
After writing is complete, pressing ENTER or the [ B ] button will reset the TWELITE and transition to the interactive mode screen (or terminal screen, depending on settings).
If you enable the setting to use VSCode (Open folder in code under App rewrite), the build will not be performed, and the screen to write .BIN files under build/ will open instead: screen.
Operation
Description
[ A ]
Menu selection up
[ A ]Long press
Exit this screen and return to the selection screen.
[ B ]
Select
[ B ]Long press
Open the related website in the OS default browser.(If registered in the project folder’s 000desc.txt)
[ C ]
Menu selection down
[ C ]Long press
Open the folder (project or related folder).You can set it to open with VS Code in the settings menu.
ESC
Exit this screen and return to the app rewrite menu.
Mouse click [Help]
Open the related website.
Mouse click [Folder] or [VSCode]
Open the related folder.
Mouse click [▽] or [△]
Move to the next or previous page.
2.2.2.5 - Folder (Specify)
Write a specified firmware
Windows
macOS
Linux
By dragging and dropping a folder or .BIN file onto the TWELITE STAGE APP screen, you can write a specific project. Select the dropped target when performing build or write operations.
When you drop a .BIN file, the firmware list in the folder containing that file will be displayed, just as if you had dropped the folder itself.
2.2.2.6 - Last (Re-execute)
Re-execute writing the most recently written firmware
Windows
macOS
Linux
RasPi
Re-select the most recently rewritten or specified project.
Depending on the item, one of the following will be performed:
Rewrite the selected project
Redisplay the list of recently selected projects
2.2.2.7 - Build & Write Screen
Operation instructions for the build & write screen
Windows
macOS
Linux
RasPi
This section provides operation instructions for the screen displayed when building or writing a project.
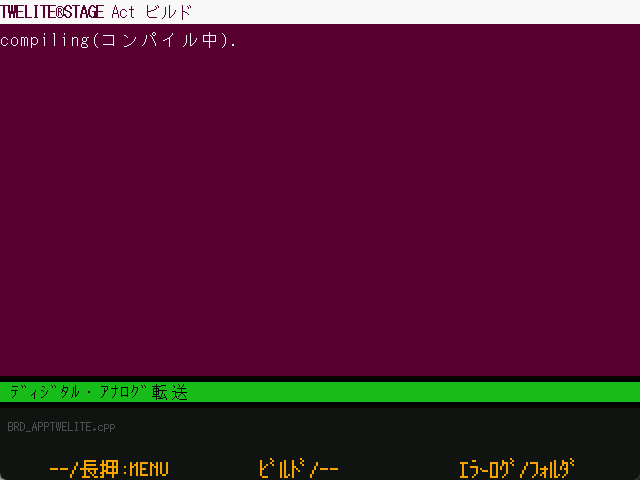
During Build
This is the screen during the build (compile) process. The contents of the build command are output to the console screen. The ... in the middle of the screen indicates the number of files built, and the dark-colored display at the bottom shows the filenames currently being built.
Example of the screen during compilation
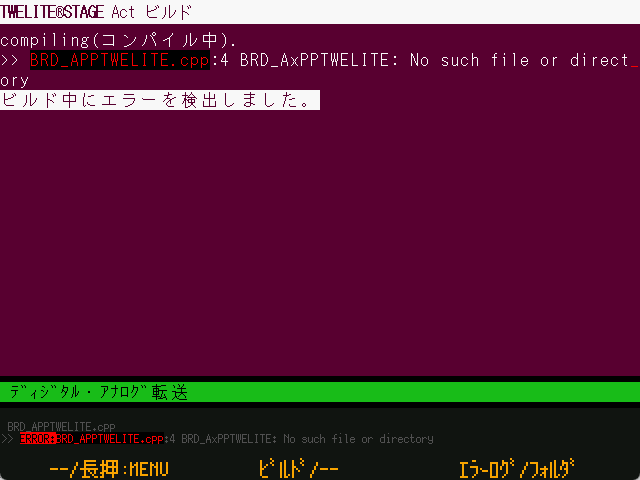
Build Error
If a build error occurs, a screen like the one above is displayed. You can execute a rebuild or display the error log. Also, after a certain timeout, it will return to the previous menu.
Example of error display screen
Only representative error messages are displayed on the screen. When the build fails, there may be cases where the error message is not displayed.
Operation
Description
[ A ]
No assignment
[ A ]Long press
Exit this screen and return to the previous menu.
[ B ]
Rebuild on error.
[ B ]Long press
No assignment
[ C ]
[ C ]Long press
Display the error log (Windows/macOS).The save location is {project folder}/build/builderr.log.
ESC
Exit this screen and return to the write menu.
ENTER
Rebuild on error.
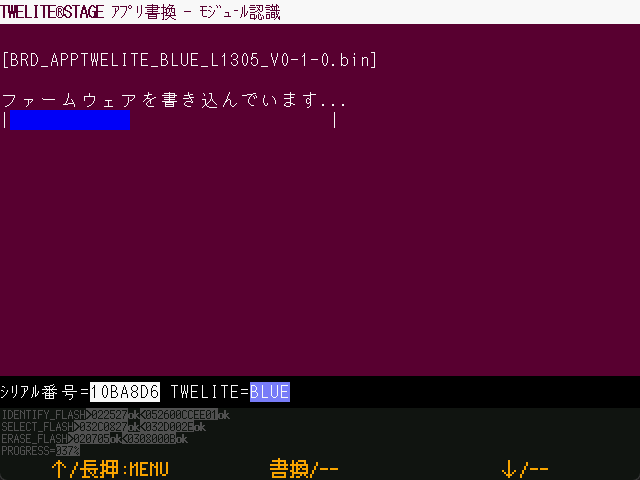
During Write
When the build succeeds, the screen to write the firmware is displayed.
Example of write-in-progress screen
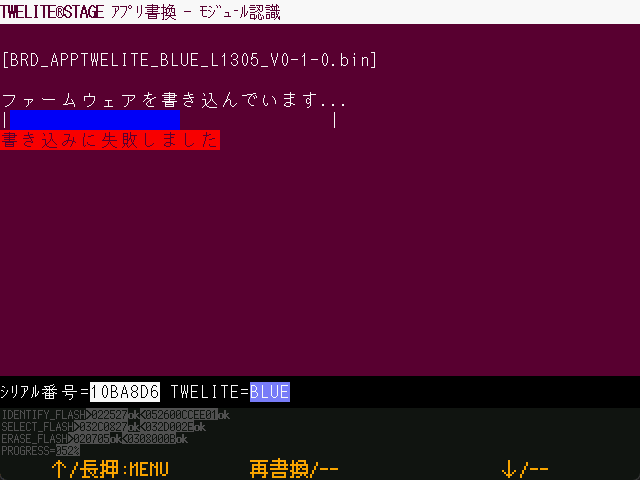
Write Failure
If writing results in an error, a screen like the one below is displayed.
Example of write failure screen
Operation
Description
[ A ]Long press
Exit this screen and return to the selection screen.
[ B ]
Rewrite again(Returns to the previous write menu.Since the menu item is automatically selected,pressing [ B ] again will rewrite.)
ESC
Exit this screen and return to the write menu.
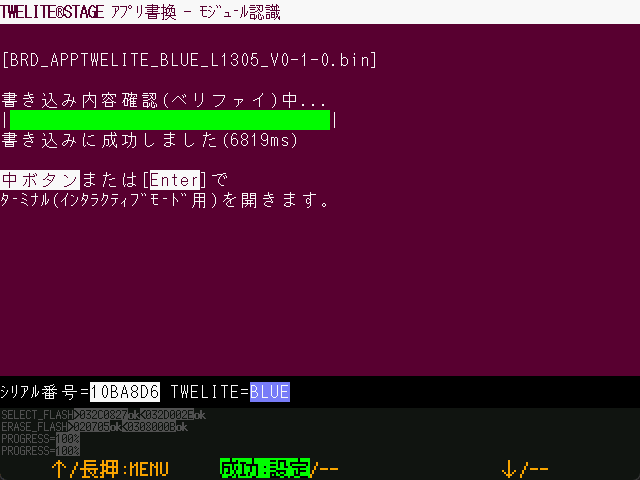
Write Complete
When writing completes successfully, a screen like the one below is displayed.
Example of write completion screen
From version 1.0.2 onwards, after firmware writing, a verify process is performed to read back and confirm the written content.
Operation
Description
[ A ]Long press
Exit this screen and return to the selection screen.
[ B ]
Reset the TWELITE and move to the interactive mode screen (or terminal screen depending on settings).
ESC
Exit this screen and return to the write menu.
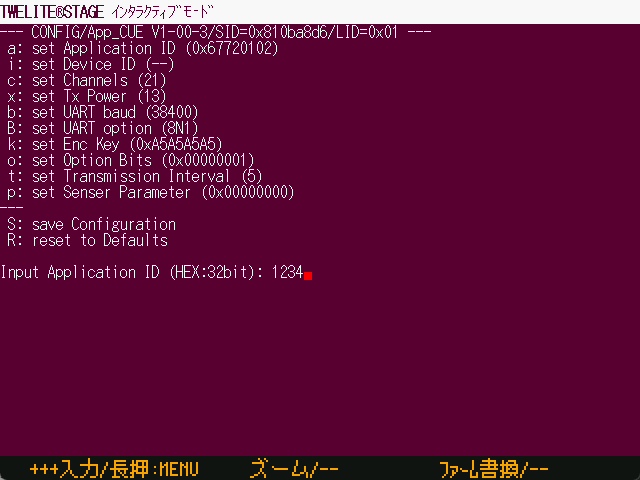
2.2.3 - Interactive Settings Mode
Using Interactive Settings Mode
Windows
macOS
Linux
RasPi
Overview
From this screen, you can use the interactive mode of the connected TWELITE.
Example of the Interactive Mode screen
This screen behaves almost the same as a terminal, but adds functions specific to interactive mode, such as operations to transition to interactive mode and detection of exit from it.
The connected TWELITE must have firmware compatible with interactive mode pre-installed.
Since TWELITE input/output is used, if garbled characters occur in serial communication, transitions to and exits from interactive mode may not work as expected.
Mouse operations are not supported. Please use keyboard operations (cursor ↑↓ keys are usable).
You can also transition to and operate interactive mode using the Terminal.
In the terminal, the SET pin operation is not performed automatically. You need to manually set the SET pin to LO.
In the terminal, operations such as entering + + +, Alt(⌘)+I for interactive mode, and module reset Alt(⌘)+R are also defined.
Interactive Mode Screen Operation Flow
Below is an outline of the process flow.
[Set screen background to black]
  ↓
[Reset TWELITE (if controllable, SET=LO)]
  ↓
 --YES--> [Operation screen]
  ↓timeout
[Input '+' three times]
  ↓
 --YES--> [Operation screen]
  ↓timeout
[Operation screen] ※ This state is not interactive mode

[Operation screen]
  ↓
 --> [Exit]
  ↓
 --> [Exit]
  ↓
 ->  --NO-> [Exit]
  ↓            ↓
[Send input string to TWELITE]
  ↓
[Return to operation screen]

[Exit]
  ↓
[Reset TWELITE]
  ↓
[Exit screen] Exit the interactive mode screen and return to the previous screen
2.2.4 - Settings of TWELITE STAGE
Settings for TWELITE STAGE APP
Windows
macOS
Linux
RasPi
Overview
From this screen, you can configure various settings of the TWELITE STAGE APP.
Example of the settings screen
The menu on this screen cannot be operated with a mouse.
Also, changing the screen colors may make it difficult to see.
Some menu items explained below may not exist on certain platforms, but all are listed and explained.
Color settings other than the common menu are omitted from the explanation.
Root Menu
Common
 Terminal
 Standard App Viewer
 Graph Viewer (Acceleration Real-time/Sensors)
 Simple Monitor (CUA/ARIA/Glancer)
 Commander
 Write firmware
 Interactive Settings Mode
Save Data Utilities (Dump/Erase)
Information
Common Settings
a: (      0x00) Startup App Specification
G: (      0x00) Screen Size and Drawing Method
F: (          ) Serial Device ID
f: (0x00FFFFFF) Foreground (Text) Color
b: (0x005A0032) Background Color
B: (    115200) Baud Rate
Setting
Description
Startup App Specification
This setting determines which viewer app to switch to when TWELITE STAGE starts.The setting value is 1..{the number listed in the viewer app menu}.Note: If the serial device ID is not set,the startup will wait for input on the serial device selection screen.
Screen Size and Drawing Method
(Except for M5Stack version) Specified by two characters XY (X: screen size, Y: drawing method).X0:640x480 1:1280x720 2:1280x960 3:1920x1440 4:2560x1440 5:320x240Y0:LCD style 1:CRT style 2:Blur 3:Block
Serial Device ID
(Except for M5Stack version) Set by serial device name or a number 1..9.Note: The number indicates the device enumeration order.
Text Color / Background Color
Specify text and background colors.The common settings color values are inherited by other screens’ settings.If not set on other screens, the common settings colors are used.Colors are specified as 24-bit RGB hexadecimal values but are internally rounded to 16-bit 565 format.
Baud Rate
Set to avoid garbled display in terminals etc. when the TWELITE baud rate is not 115200.
Write Firmware
f: (0x00FFFFFF) Foreground (Text) Color
b: (0x005A0032) Background Color
j: (         0) Number of make jobs at build time
v: (         0) Open a folder with VSCode
l: (         0) Disable LTO
n: (         0) Screen after rewriting is completed
Setting
Description
Number of make jobs at build time
(Except for M5Stack version) Number of parallel jobs during build to shorten build time.Default 0 calculates jobs as (physical processor count - 1).A guideline is to set up to the number of logical processors.
Open a folder with VSCode
(Requires VSCode installation) Setting 1 opens folders using the code command (VSCode) instead of the OS standard folder window.The executable TWELITE_Stage_VSCode defaults to 1.
Screen after rewriting is completed
(Except for M5Stack version) Setting 1 opens the terminal instead of the interactive mode screen.Setting 2 returns to the rewrite menu.TWELITE_Stage_VSCode sets this to 2.
Disable LTO
(Windows only) Setting 1 disables LTO in the Windows compiler.LTO produces smaller binaries but takes longer to link.Disabling LTO results in faster linking.
Save Data Utilities
r: Read sector.
R: Read ALL sectors.
e: Erase sector.
E: Erase ALL sectors.
This screen is a utility for maintaining data save areas. It emulates EEPROM (64 bytes per sector, up to 60 sectors, 3840 bytes).
Setting
Description
r
Reads a sector.Input 0..59 to display the contents of the specified sector.
R
Input YES to read all sectors, but only the tail part is displayed.
e
Erases a sector (0xFF).Input 0..59 to erase the specified sector.
E
Input YES to erase all sectors.
On Windows, macOS, Linux, and Raspberry Pi, data is saved in {executable name}.sav (default TWELITE_Stage.sav file).
2.2.5 - Select SERIAL port
Select SERIAL port menu
Windows
macOS
Linux
RasPi
Overview
On this screen, you can (re)select the serial port.
Example of the serial port selection screen
Instead of using this screen, you can also switch the serial port with Alt(⌘)+0, Alt(⌘)+1,2,...
3 - Logging Function
Logging function between TWELITE and PC
Windows
macOS
Linux
RasPi
You can record serial communication logs between TWELITE and PC.
Operation
Start Recording
Press Alt(Cmd)+L.
Example of the log start screen
Stop Recording
While recording, press Alt(Cmd)+L again.
Example of the log stop screen
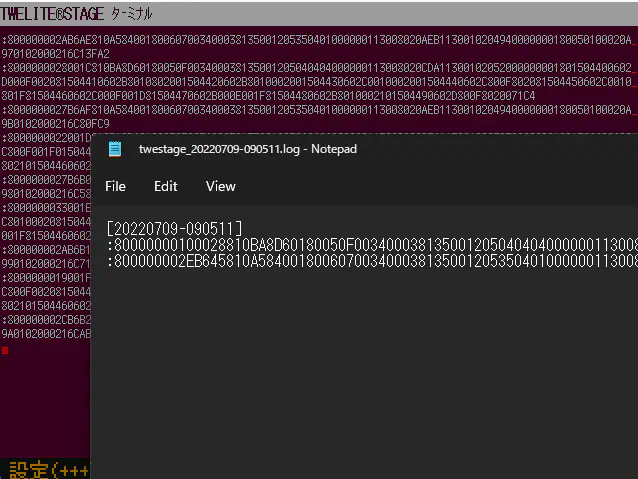
The log recording will stop, and the log file at that point will be opened using the OS default application (Notepad on Windows, Console.app on macOS).
On Raspberry Pi, only saving the log file is performed. There is no function to automatically open the log file.
Specifications
Log Recording
Strings received from TWELITE are recorded as-is.
Strings sent to TWELITE are recorded one character at a time.
On Windows, they are enclosed in 「 」, and on macOS / Linux / Raspberry Pi, they are enclosed in « ».
For example, «t» means that the character t was input from the keyboard.
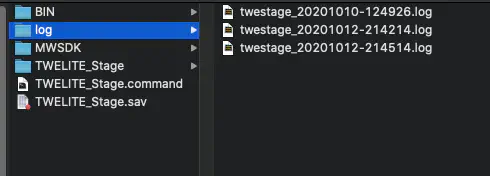
Log Folder and File Name
Logs are saved in the {folder where the TWELITE STAGE APP executable is located}/log folder, with a file name based on the start date and time of the logging.
![Example of virtual [ B ] button displayed at the bottom of the screen](../../../../../../images/stage-app-abc-button.webp)